This is a report by The Project on Accountable Justice.
Deborrah Brodsky edited and produced this report.
Cyrus O’Brien was the lead writer.
Alexandra Raynolds and Nicholas Truitt contributed research.
Another year has come and gone and the Florida Legislature failed to prioritize systemic criminal justice reform. Yet Florida’s prison system remains in crisis, plagued by years of documented problems in staffing, safety, health care, transportation, and facilities. This inaction assures the system persists as dire and dangerous, with no prescription yet written for sustained and systemic improvement.1 Floridians deserve a deliberate and accountable response.
With 97,000 prisoners, another 135,000 people under probation or similar supervision, a staff of more than 20,000 employees, and numerous private contracts to manage, Florida’s prison system is massive. And reforming it is understandably a massive undertaking. But it can be done through concerted action.
Click here to continue reading...
As the third largest prison system in the country, the Florida Department of Corrections is an entity comparable in size to the populations of St. Petersburg or Orlando; it’s larger still than 43 of Florida’s 67 counties.2 The expanse of the system also demands expense. Florida taxpayers will spend more than $2.4 billion this year, and will continue to spend at least as much each and every year for the foreseeable future. Florida also has one of the highest incarceration rates in the country — a rate more than 20 percent higher than the national average.3
Florida policy makers should be readily able to answer how well these fundamental characteristics of Florida’s prison system — high incarceration rates and enormous public expenditures — meet rigorous standards for both safety and cost-efficiency. Do the current investments, practices, and policy strategies employed by our state’s criminal justice and correctional systems result in the safety returns Floridians expect and deserve?
We call attention to these questions, noting that, though Florida continues to experience a decades-low crime rate, the crime rate is 15 percent higher than the national average.4 We call further attention as we ponder the resulting outcomes evidenced as more than 30,000 people cycle in and out of the Florida prison system each year. Nearly all prisoners (87 percent) eventually return to our communities, so meeting the rehabilitative purposes of our corrections system is imperative for safety. Yet 69 percent of prisoners are re-arrested within three years of release.5
While noting the many structural and operational deficiencies of the system, which the Project on Accountable Justice and others have addressed previously, this report further illuminates areas for discussion and remedy. In particular, Florida’s current sentencing regime demands a review.
Although prison admissions over the past decade declined 28 percent, sentence lengths increased by 22 percent.6 How much more safety do Floridians get with this increase? “There is considerable research validated by the FDC (and others) that the length of imprisonment has no impact on recidivism rates.”7
“Among national criminal justice reform advocates, Florida is the great ‘white whale.’ It is the state that every reformer dreams about as fervently as Captain Ahab dreamed about Moby-Dick. Over the last 10 years, most of the states in the American South have passed major reform legislation to improve public safety, cut wasteful spending, and better restore victims — but Florida, one of the biggest and most influential states in the country, has remained a stubborn exception.” Vikrant Reddy, Charles Koch Institute, The Journal of the James Madison Institute (October 2016).
We spend $300 million a year to incarcerate people for drug offenses, but less than $1.50 a day to educate and rehabilitate a prisoner. We release more than 30,000 people per year, yet 69 percent will be re-arrested within three years.
It’s true that by locking up dangerous people, the Florida prison system incapacitates some of the most dangerous criminals. But it is also true that the Florida prison system might more effectively leverage its resources — both financial and human — through shifting, as appropriate, more resources toward the expansion of safe and proven alternatives to prison like community-driven sanctions and research-driven accountability mechanisms like veterans and drug courts.
Seventy percent of people entering prison in FY2015 were sentenced for a non-violent offense; fifty-five percent of prison admissions had no FDC record of any violent felony; we imprison more than 15,000 people for drug offenses. In these cases, is a prison sentence always the most beneficial and cost-effective response?
We did not get here overnight, nor will these problems be alleviated overnight. The condition Florida finds itself in is the result of decades of criminal justice policies that have often been at cross-purposes. Efforts by policy makers in years past to reform the system have proved meager in the face of laws and policies like mandatory minimums and sentencing enhancements. Like all public policy decisions, prison population expansion should have been met with tough accountability questions — the kinds of questions we ask readers to pose while looking at our findings and others.
We cannot stress enough that this will require the diligence of Florida’s policy makers to undergo a systemic policy and budget examination, which can only be supported through rigorous and continued data examination. Otherwise we will remain forever behind the eight ball. The Florida prison system will not fix itself.
A recent example occurred in the 2017 Session. The Florida Legislature increased the budget of the Department of Corrections by $35 million. These funds were needed. The state’s prison system is operating far below minimum staffing levels necessary to ensure basic safety, let alone hire staff to administer the kinds of educational and rehabilitative programs that are proven to reduce re-offending when people are released. But these stopgap funds will have only the most limited impacts; they are enough to replace some old vehicles, but fill only one-quarter of the deficit of security staff. Our taxpayer investments in Florida’s prison system should do more than merely get us through to the next fiscal year. There are numerous examples to reflect upon — many of which have been delivered previously to the Florida Legislature and the Governor.
Without significant change, Florida will remain on its current path, spending billions of taxpayer dollars without a plan beyond the next fiscal year. Of course, money for corrections means less money for everything else — most relevantly for proven alternatives to incarceration that measurably achieve more for public safety — for more officer training, drug treatment and community mental health programs, for specialized courts, for re-entry supports and services aimed to keep fewer people from returning to crime.
Florida can take a different path. We can make reducing our prison population a priority. We can re-engineer our criminal justice system to serve the ends of public safety. And we can use research to ensure that we do this safely. Other states — Georgia, Texas, South Carolina, Oklahoma, Alabama, Mississippi and the latest neighbor added to the rolls, Louisiana — are leveraging data to cut costs better meeting the needs of their citizens as a result.8
Floridians strongly support change. Seventy-two percent of us agree or strongly agree that it is important to reform the criminal justice system in Florida. Even more agree that the prison population is costing our country too much money. And almost two-thirds of Floridians want to find ways to release prisoners serving time for nonviolent offenses.9 These results are instructional — and point to the public’s expectation that we must do better.
This report is an effort to help Florida’s citizens and policy makers understand the nature of some of the problems found in the criminal justice system, notably resulting in dangerous prisons. It shows who is going to prison and why, and who is in prison and for how long. It also suggests opportunities for reform. It reveals disparities that suggest that how the justice system treats you may depend more on where you live than what you do. Floridians must decide whether we will be party to a system that is failing, or embrace the immense opportunities to use data to drive change. Please think about this question as you read this report, and imagine a healthier correctional system that keeps us safe and wisely invests in what works to reduce crime and costs.
Deborrah Brodsky, November 2017
This report is a Data-Driven Document and contains many interactive data visualizations.10 Hovering over most charts will reveal additional levels of detail, and many charts are clickable. Two charts (a cartogram of US prison populations and a timeline showing Florida’s prison growth) require you to click on them in order to view the visualization. Where clicking reveals additional data or functionality, you will see this symbol ![]() .
.
There are currently more than 1.5 million people in American prisons, and another 700,000 in local jails. At the end of 2015, 153,000 Floridians were in prison or jail. Florida’s incarceration rate is 20 percent higher than the national average.
No other country incarcerates as many people as the United States. The US incarceration rate, of 666 people per 100,000 residents, is nearly five times higher than that of the United Kingdom, which itself has a relatively high rate of incarceration compared to other economically developed democracies. Only Cuba and Russia, both with non-democratic governments, begin to approach the United States when it comes to incarceration.11
Note: North Korea does not provide reliable data, but the best estimates available conclude that North Korea confines between 150,000 and 200,000 people, resulting in an incarceration rate between 600 and 800 per 100,000 residents. These data indicate that North Korea is the only sizable country whose incarceration rate may be higher than that of the United States.
Note: This Demers Cartogram depicts only incarceration in state prisons. People incarcerated in federal prisons, local jails, immigration detention centers, or juvenile facilities are not represented in this cartogram. For notes on the data, see note 12.
Mass incarceration affects all of the United States, but only California and Texas have larger prison populations than Florida. Louisiana, Oklahoma, and Delaware have the highest rates of incarceration. Florida’s imprisonment rate (500 prisoners per 100,000 residents of all ages) is 20 percent higher than the national average.
As you watch the size of each state’s prison population expand in the cartogram above, compare the trajectories of New York and Florida. Throughout the 1980s and 1990s, the two states had similar prison populations and similar rates of imprisonment. Both states were early adopters of laws that increased penalties for drugs and lengthened sentences for violent offenses. After 2000, however, the two states diverged. New York scaled back its War on Drugs and maintained parole as a method to release people deemed to pose little threat to public safety. Florida, on the other hand, doubled down on drug offenses — passing laws to increase penalties for opioids and making possession charges easier to prosecute. Florida also passed a law called “10-20-Life,” which established mandatory minimum sentences for people who used a gun during a crime. Some people who fired a warning shot in self-defense but never hurt anyone have been sentenced to 20 years in prison under this law. Florida’s abolition of parole in 1983 also limited the ability of the state to release people who had demonstrated rehabilitation and posed little or no threat to public safety. These policy divergences have culminated in a profound difference: Florida has almost twice as many prisoners as New York.
Although policy differences resulted in vastly different prison populations and their associated costs, the two paths taken by Florida and New York did not result in different outcomes when it came to crimes committed. Both states have seen crime rates decrease significantly since 2000. New York’s crime rate is down 36 percent, and Florida’s, though still higher than New York’s, is down 42 percent.13
The US prison population has septupled since 1970. In 1970, Florida had the third highest imprisonment rate in the country — of each 100,000 residents, 135 were prisoners. Oklahoma (with an imprisonment rate of 142 per 100,000 residents) led the nation in imprisonment. Today, Massachusetts, the state with the country’s lowest imprisonment has a higher state imprisonment rate (146 per 100,000 residents) than the highest in 1970 (Oklahoma — 142 per 100,000 residents). (It is worth noting that Massachusetts’ imprisonment rate is deflated because it sentences many people to incarceration in local jails instead of prison; its total incarceration rate is significantly higher.) If Florida had today the same imprisonment rate it had in 1970, it would confine 71,000 fewer people in its prisons. If the costs per prisoner remained the same, the state would avoid $1.5 billion in corrections expenses every year.14
For decades, Florida legislators have known that prisons are costly and inefficient, and they have occasionally taken steps to reduce the state’s overreliance on incarceration. The Legislature established (and later repealed) a ceiling for the prison population. It instituted procedures to allow prison and parole administrators to release people before the end of their sentence — at times to address overcrowding and in response to litigation, but also as a way to incentivize good behavior and in recognition of prisoners’ ultimate return to Florida communities. On numerous occasions, the Legislature appropriated money to improve rehabilitation programs.
None of these efforts has been successful in reducing Florida’s prison population, in large part because the Legislature almost simultaneously took actions that pushed the criminal justice system in the opposite direction. Legislators increased penalties for drugs (in 1987, 1989, 1992, 1994 and more), ratcheted up punitive responses across the board, and slowly stripped judges of their power and discretion, effectively transferring authority from judges to prosecutors.
When these policies predictably resulted in an extremely high rate of incarceration, state policy makers took steps to hide the costs from taxpayers, borrowing billions of dollars and shifting the costs to future. From 1987 to 2011, the state embarked on an unprecedented construction spree, building 46 new prisons and 34 new smaller facilities.15
In 1983, the Florida Legislature passed a law that it hoped would act as a “reasonable containment of criminal justice expenditures.” It placed a ceiling on the number of prisoners the state could confine – 275 per 100,000 residents. The legislation provided that, over time and as Florida invested in noncustodial alternatives to incarceration, this ceiling would fall to 250 prisoners per 100,000 residents. By way of comparison, Florida’s state imprisonment rate today is 500 per 100,000 residents. (This figure reflects only the state prison population, and does not include people confined in county jails, federal prisons, or juvenile lockup facilities.)
The Legislature was motivated not only by the expenses of building and maintaining prisons, but also by recognition that incarceration was not the only method nor, under certain circumstances, the most effective way of ensuring public safety and rehabilitating people. The 1983 legislation provided increased funds for alternatives to incarceration, and was, in part, motivated by the Legislature’s observation that “[t]he effectiveness of incarceration … is not conclusively positive.”16
The Legislature took some steps to keep Florida’s prison population below the 1983 ceiling. In 1987, it introduced “administrative gain time,” a process by which prisoners who behaved well while in prison received time off of their sentences.17
Efforts to limit the number of people in Florida’s prisons were quickly overwhelmed by the effects of policies and practices that drew more people into the criminal justice system. New laws increased penalties for drug offenses, lengthened sentences for many types of offenses, and ensured that prisoners would spend more time in prison.18
Instead of paying for prison construction with cash through payments known as “fixed capital appropriation” (a more rigorous and scrutinized process of state budgeting), a newly-empowered state agency named the Correctional Privatization Commission took out enormous loans to build new prison facilities. Even after the Correctional Privatization Commission was shut down (due to a flurry of corruption scandals), Florida continued to borrow money to build new prisons. Between FY2006 and FY2011, the state spent or borrowed almost $1.5 billion to pay for prison construction. This spending paid for prisons to be constructed in Lafayette, Gadsden, Marion, Washington, Wakulla, Jackson, Polk, Santa Rosa, and Suwanee Counties.19
In 2015, Florida still owed more than $500 million in principle of the debts it incurred for prison construction. By the time Florida pays off these debts in 2030, taxpayers will have paid an additional $690 million in debt service.20
This report uses two methodologies for determining an individual’s offense: “committing” offense and “longest” offense. Both result from an analysis of data provided by the Florida Department of Corrections. By either measure, non-violent offenses account for a significant majority of prison admissions.
The Committing Offense is the most serious charge for which an individual is sentenced to prison. It prioritizes violent offenses over property, drug, and other offenses. The Committing Offense variable captures violations of probation, parole, and conditional release.21
The Longest Sentenced Offense is the offense that carries the longest sentence, regardless of the seriousness of the offense. However, when two offenses carry the same sentence, this variable, like Committing Offense, prioritizes violence. In cases where an individual is admitted to prison for a violation of probation or parole, the Longest Sentenced Offense reveals the underlying charge, not the violation.
Committing Offense is most valuable in determining why someone was sentenced to prison. In showing probation and parole violations, it emphasizes the role that parallel criminal justice institutions play in mass incarceration and highlights reforms in practice that could be implemented administratively.
Longest Sentenced Offense is most useful in understanding what changes in law are required to reduce the number of people Florida holds in prison, particularly as they might relate to sentencing.
For detailed examples of how and when these methodologies are most useful, see Appendix A.
Probation violations (VOPs) comprise 15 percent of prison admissions. In FY2015, 5,712 people were in prison due to a VOP, costing the state more than $107 million.
Prison admissions for violations of probation are in large part driven by Department of Corrections policy. This is because most VOP admissions are precipitated by technical violations. Technical violations are behaviors that are against the rules of probation – like missing a curfew deadline – but are not by themselves against the law. It is important to note that although violations of probation sometimes consist of serious new law violations, previous studies have found that only 25 percent of people admitted to prison for a violation of probation had been recently arrested for a felony; most had not been arrested for a new offense.22
The Department of Corrections, along with courts, has broad discretion in how to treat technical violations and other misbehavior that, itself, does not violate the law. From 2003 until mid-2008, the Department of Corrections maintained a “Zero Tolerance” policy regarding technical violations. This meant probation officers were required to file violations whenever someone under their supervision was not in full compliance – even when an officer believed lack of full compliance did not threaten public safety.
Predictably, the Zero Tolerance policy resulted in many more people being sent to prison for violations of probation. By FY2008, admissions for violations of probation increased two-and-a-half fold.
Since the Department rescinded its Zero Tolerance policy, admissions for VOPs are down significantly. Between FY2008 and FY2012, VOPs fell 35 percent. Since 2012, prison admissions for VOPs have increased slightly. They remain 33 percent higher than they were prior to the Zero Tolerance policy.
In 2016, the Florida Legislature passed a bill that created an “Alternative Sanction Program.” The program, which had been piloted since 2013, allows judges to opt to use alternative responses to technical violations. The program is intended to increase efficiency, improve outcomes, and decrease revocations.
More than 70 percent of people sent to prison for VOPs in FY2015 were on probation for a nonviolent offense. The most common underlying offenses (the offenses for which an individual was under probation supervision) involved drugs and property.
The majority of probation violators in FY2015 had no record of a violent felony in their Florida Department of Corrections record. (This includes only cases sentenced to state prison or a form of community supervision.)
Note: A small number of cases of violations of probation involved very serious offenses, such as murder and some sex offenses, provoking the question of why people with very serious offenses were placed on probation. These cases mostly involved the use of blended sentences: A court sentenced the initial offense to a term of imprisonment followed by a term of probation. This means that, after serving the full term of imprisonment, individuals with such sentences were placed on probation after their release. Like anyone on probation, these individuals could have their probation revoked for failing to fully comply with its terms. Most people whose underlying offense was very serious had already served a prison sentence before their probation was revoked.
Within the general policies set by the Legislature and the Florida Department of Corrections, local officials retain wide degrees of discretion. In practice, this means that the same behavior will result in vastly different consequences depending on where you live, who your probation officer is, and who works in your local courthouse.23
Click on any Circuit to track its position as the chart transforms according to absolute numbers and rate.
In Florida’s criminal justice system, your ZIP code and the color of your skin can sometimes matter more than your behavior. Disparities between circuits are a product of the criminal justice system’s relative decentralization. Each circuit has its own judges, prosecutors, defense attorneys, probation officers, and police forces. The decisions these people make — individually and collectively — determine who is punished and how.
Racial and jurisdictional disparities are most apparent in analyses of less serious cases (like drug offense and probation violations) where decision-makers exercise more discretion. Florida’s criminal justice system produces significant racial and jurisdictional disparities, especially in the enforcement of the terms of probation and of drug offenses.
Note (December 2018): An earlier version of this report underreported incarceration rates for white Floridians. These revised figures are based on FDC reporting of prisoners’ race and ethnicity and census estimates of populations. Figures for white adults refer only to white non-Hispanic adults.
Statewide, one in 42 black adults was incarcerated by the Florida Department of Corrections in a FY2015 snapshot. For white adults, the figure was one in 229. Florida’s 19th Circuit (Okeechobee) had the most severe racial disparities. One in 24 black adults in the 19th Circuit was imprisoned in FY2015 — more than eleven times the rate of their white neighbors.
Florida’s different jurisdictions produce disparate results. White adults in the 3rd Circuit (Lake City and its environs) were twice as likely as whites in the 19th Circuit (Okeechobee), three times more likely than whites in the 17th Circuit (Fort Lauderdale) and almost five times more likely than whites in the 11th (Miami) and 15th (Palm Beach) Circuits to be imprisoned.
Statewide, black adults are almost twice as likely to be in prison for a drug offense than residents of the UK are to be in prison for any reason.
In almost every circuit in Florida, the incarceration rate of black adults solely for drugs is higher than the total incarceration rate for similar countries. The 15th Circuit (Palm Beach) has a drug incarceration rate for black adults of 173 per 100,000. The United Kingdom’s incarceration rate for all offenses is 187 per 100,000.24
When racial and jurisdictional differences compound, the disparities can be astounding. Black adults in the 19th Circuit (Okeechobee) are 110 times more likely to be incarcerated for drugs than white adults in Palm Beach. Put another way, if the general populations were equivalent, for every white prisoner incarcerated for drugs from Palm Beach there would be 110 black prisoners from Okeechobee.
Though to a less extreme degree, white Floridians are also heavily impacted by the War on Drugs. In some rural areas, such as the 3rd (Lake City) and 14th (Panama City) Circuits, the white adult drug incarceration rates are 194 and 149, respectively.
Each and every year, approximately 32,000 people are released from Florida prisons — one third of the prison population. And every year, they are replaced by another 32,000 people who are admitted to prison. Florida’s prisons system is typical in this regard: Nationally, one-third of the prison population — more than 600,000 people — are released each year.25
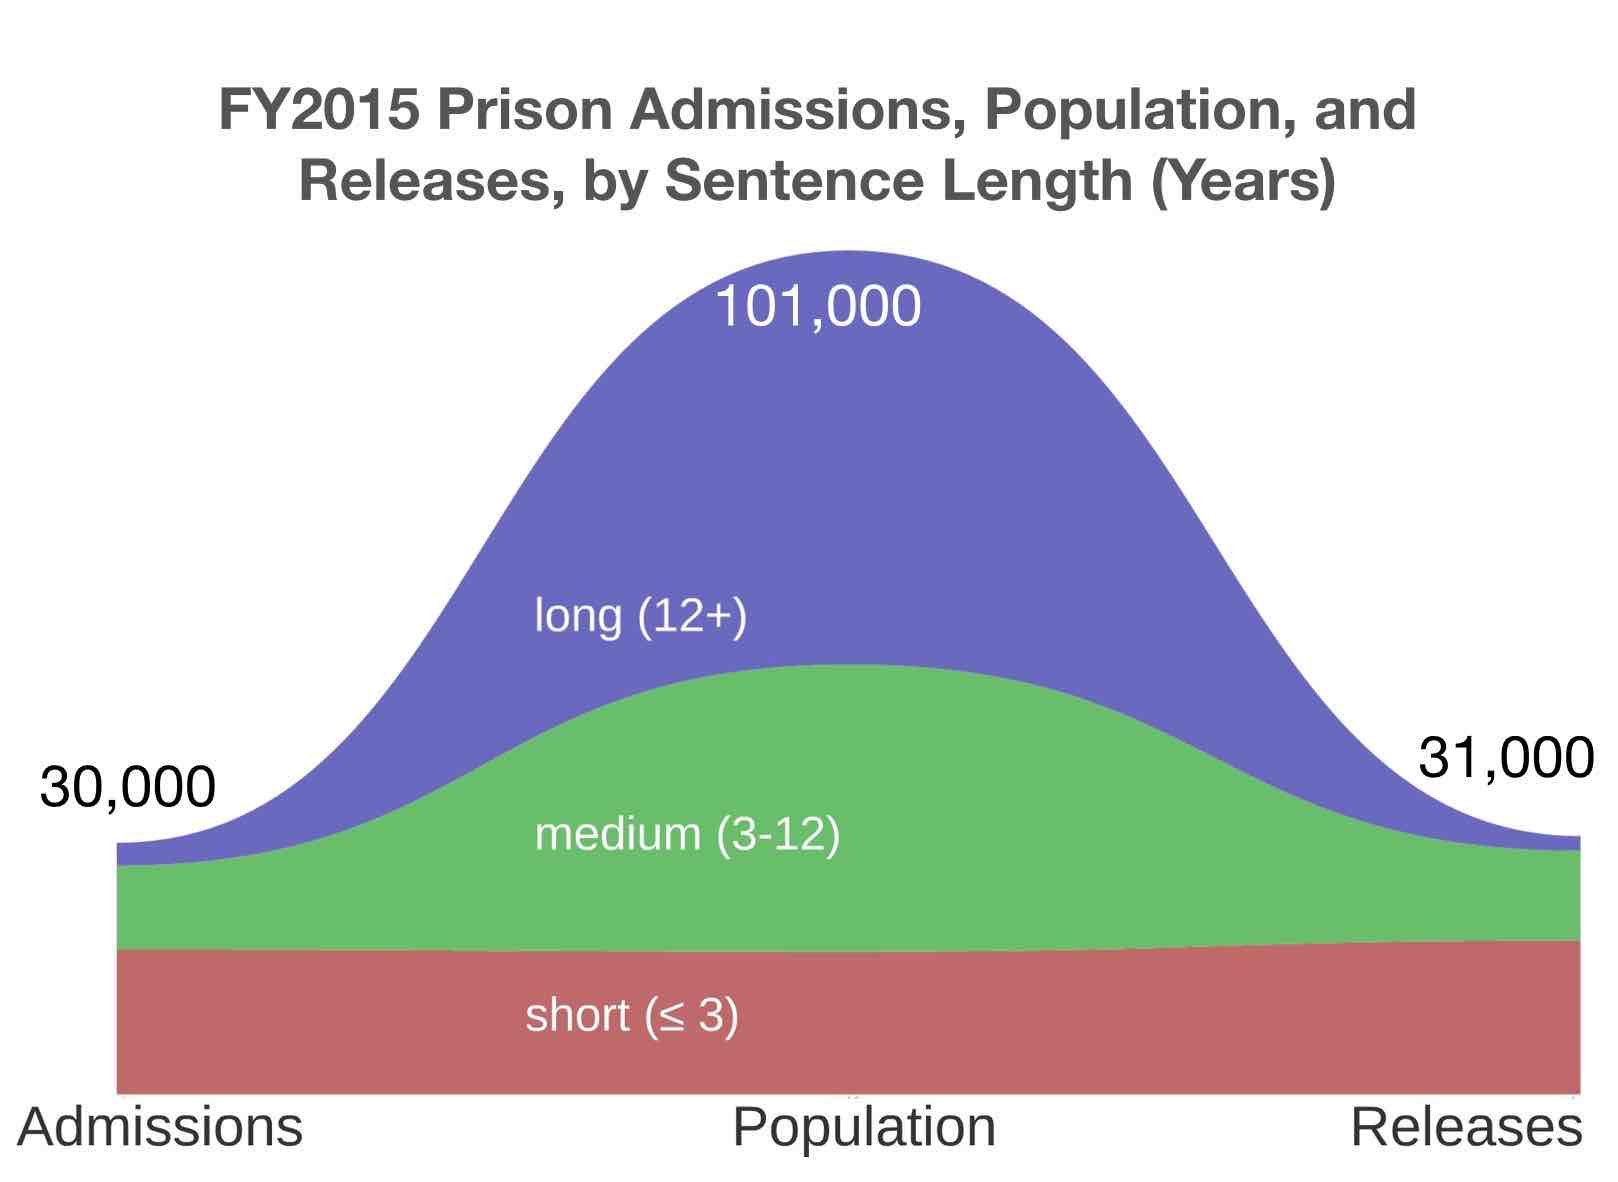
People with relatively short sentences (defined here as three years or less) make up most of the turnover of the prison system, but a relatively small portion of the prison population. They comprise 55 percent of all people admitted to prison each year, but amount to only 17 percent of the prison population.
On the other hand, people with very long sentences (12 years or longer) make up very little of the turnover but comprise the bulk of the prison population. People with very long sentences make up only 9 percent of prison admissions, but, because they stay for so long, they amount to 49 percent of the population.
Most people serving short sentences in FY2015 were incarcerated for a non-violent offense. Most people serving long sentences, by contrast, were incarcerated for a violent offense.
In FY2015, there were 3,552 people serving very long sentences for drug offenses. The imprisonment of these people in FY2015 cost the state $70 million. The total cost of incarcerating these people for the duration of their sentences will exceed $1 billion.26
Fifty-five percent of Florida’s prison population was incarcerated for a violent offense in a FY2015 snapshot. In the 1980s and 1990s, the Florida Legislature passed laws with slogans like “truth in sentencing” and “life means life,” and abolished parole and other forms of discretionary release. These laws and policies have resulted in people staying in prison for extremely long periods of time, often beyond the point where they ceased to be a risk to public safety. Mandatory minimum sentences (especially 10-20-Life) also forced judges to impose extremely long prison sentences. Florida is one of only a handful of states that does not have a system for releasing people who have served significant periods of time and do not pose a risk to public safety.
Nearly one in four people in Florida’s prisons (23,500 individuals) was elderly (50 or older) in 2016. Elderly inmates are a demographic group that costs the state significantly more to imprison, especially in expenses related to health care.27
Criminological studies have shown that most people age out of criminal behavior by age thirty. In general, as people age, they are much less likely to engage in crime.28
Data tracking the re-imprisonment of people released from Florida prisons reflects these broader trends. Only 2 percent of people age 60 or older released from Florida prisons between FY2005 and FY2010 were re-imprisoned for a violent felony within five years of their release. Overall, 19 percent of people 60 and older returned to prison, but 32 percent of these recidivists were re-incarcerated for a violation — not a new offense.
Note: The methodology of this recidivism analysis differs from that of the Florida Department of Corrections in several ways. This analysis identified all people released from Florida prisons between July 1, 2005 and June 30, 2010, and followed each of them for five years. An individual was considered a recidivist if he or she returned to prison within the five-year time frame, in which case the reason for his or her return was recorded. If an individual appeared multiple times in the sample (i.e., he or she was released from Florida prisons twice during the study period) both releases were included in the sample, which consisted of 177,317 observations. Overall, thirty-eight percent of releases returned to prison within five years. (The Florida Department of Corrections considers only “first releases,” or the very first time an individual was released from their facilities. All subsequent entries and releases are excluded from FDC’s analyses.)29
In a FY2015 snapshot, 15,042 people were in prison for drug offenses. The cost of incarcerating these people was $301.9 million.
There are vast differences in how Florida’s circuits use incarceration when it comes to drug offenses, even though the costs of incarceration are shared by all of Florida’s jurisdictions. In FY2015, Florida’s 4th Circuit (Jacksonville) was responsible for almost $30 million spent by the state to imprison people for drug offenses.30
Mandatory Minimum sentences strip judges of their discretion in handing down a sentence. Their original intention was to increase the fairness and predictability of the system, but their primary effect has been to shift power from judges to prosecutors, who still have discretion about who to charge and what charges to bring. When someone is convicted of or pleads guilty to an offense with a mandatory minimum sentence, the judge is required under law to sentence them to a minimum term of imprisonment — irrespective of any individual circumstances or mitigating factors. Though mandatory minimum sentences apply to many types of offenses (Florida’s 10-20-Life statute is one example), they most often apply to crimes involving drugs. Under current law, a judge must sentence a first-time offender convicted of possessing 50 Oxycodone pills to a 15-year term in prison — even if she believes another sentence would be more appropriate or effective.
The costs of Florida’s mandatory minimum drug offenses exceeded $106 million in FY2015.31
Note: This report defines “mandatory minimum drug inmate” as someone whose longest sentenced offense was a drug offense that carries a mandatory minimum sentence and was not incarcerated for a violent offense. In all, 6,552 people were serving sentences for mandatory minimum drug offenses. Of these, 4,805 had no co-occurring violent or property offenses.
Florida policy makers should be able to answer how well fundamental characteristics of Florida’s prison system — high incarceration rates, poor public safety returns, and enormous public expenditures — meet rigorous standards for both safety and cost-efficiency. Do the current investments, practices, and policy strategies employed by our state’s criminal justice and correctional systems result in the returns Floridians expect and deserve?
It is possible to reengineer the prison system. A smaller system that judiciously reserved incarceration only for the purpose of incapacitating dangerous individuals would face far fewer challenges and accomplish better results. Achieving a better system will require sustained, purposeful, and systemic reform. As this report shows, previous adjustments in attempts to reduce the impacts of Florida’s criminal justice system were either too limited or too fleeting to overcome the forces of inefficiency that led to growth of our prisons. Given early discussions by the Florida Legislature, coupled with heightened attention to the continuing problems faced by the prison system, we are hopeful that the 2018 Legislative Session will be a notable line in Florida’s history — a place where we depart from historical inertia and growth and instead turn to rightsizing our state’s prison system. Florida can join our neighboring states — every single state that surrounds us and many more — and take deliberate steps toward more rational criminal justice policies and practices.
We urge Florida leaders to begin to unravel the policies and practices that grow the prison population without making us safer. First and foremost, we urge Florida’s decision makers to embrace potential changes with more transparency and full accountability. This can be done with rigorous, relevant, and sustained oversight and data collection and evaluation.
The following recommendations provide additional guidance from previous research and point to ongoing efforts where there are opportunities for reform.
PAJ has previously recommended the implementation of a state-level criminal justice oversight body. We are not so much wedded to any particular structure as to the concept that external oversight is a proactive and collaborative means by which the State of Florida can improve transparency of and accountability for correctional facilities. One option to consider would build upon existing law (944.23, Florida Statutes) that authorizes the Governor, Cabinet members, members of the Legislature and Commission on Offender Review, judges of state courts, state attorneys, and public defenders to access prisons, even without notice. Several legislators have recently used their authority to heighten awareness of the problems of Florida prisons. We encourage every legislator to leverage the authority vested in them by Florida law and to explore the creation of an independent oversight body. See Recommendations to Advance Public Safety through Increased Transparency, Accountability, and Oversight of the Florida Department of Corrections.
The current money-based, rather than risk-based, bail system that drives our pretrial detention and release decisions does so at great cost, both in human and financial terms, as well as in public safety outcomes. Under the existing money bail system, people who cannot pay even small bail sums for petty offenses stay in jail for long periods of time and at great public expense while dangerous people can buy their way out. Social scientific research has demonstrated that unnecessary pretrial detention results in more and longer incarceration and increased recidivism, so this reform is likely to have entailing benefits. See Reforming Florida’s Pretrial Decision Making.)
Build upon research-based successes of the juvenile justice system and keep children out of adult court and residential sanctions. Children have an immense capacity for development and redirection. Incarceration and adult sanctions are criminogenic, meaning that they encourage rather than inhibit criminal behavior. The Florida Department of Juvenile Justice’s developmentally appropriate efforts to keep children in their communities, with familial, educational, medical, therapeutic, and social supports lead to better individual and safety outcomes. See No Place for a Child: Direct File of Juveniles Comes at a High Cost; Time to Fix Statutes.
Consider options that modernize Florida’s sentencing practices. Recent research has demonstrated that long sentences like those that characterize Florida’s prison system have been “a failed public policy.” Long sentences have cost billions of dollars and had limited effects on crime rates. The Florida Legislature should take steps to restrict incarceration to dangerous individuals, recalibrate sentences so that the punishment fits the crime, and establish systems whereby people who are no longer dangerous have a possibility to return to society as productive citizens. For example, see Smart on Sentencing: Safety Valve for Florida’s Drug Trafficking Offenses; Florida’s Aging Inmate Population; Stuck in the 80s; Poor Results, Good Intentions; The High Cost of Incarceration in Florida: Recommendations for Reform.
Reduce incarceration by encouraging local innovation, restorative justice, and community-driven solutions to crime and offending through performance incentive grants. Florida’s diverse communities face different challenges and local solutions are often the best. The savings that result from reduced incarceration should be used to form a competitive, transparent, data-driven grant process to develop locally responsive initiatives that would further reduce incarceration (i.e, pretrial services, risk assessment, specialty courts, therapeutic interventions, law enforcement training, reentry housing, etc.). See Link Juvenile Justice Funding to Performance and Better Returns for a Safer Florida: Aligning Taxpayer Investments in the Juvenile Justice System with Strategies Proven to Increase Public Safety.
Florida publicly reports, in a variety of capacities and forms, millions of pieces of data collected in the everyday operation of its corrections and criminal justice systems. However, the collection and sharing of such information may be refined and strengthened so as to support public safety priorities as well as to ensure public engagement in and accountability of their local justice systems.
Without measured results, success is indistinguishable from failure. Without understanding what success and failure look like, policy makers cannot learn what practices are working, inhibiting their ability to strategically eliminate or expand particular initiatives. One promising project that has come into Florida’s criminal justice measurement is the Measures for Justice data portal. At present, there are six states included and as many as 32 “Measures” of county-level criminal justice performance, from arrest to post-conviction in terms of fair process, public safety, and fiscal responsibility. Currently Florida’s county-level criminal justice data populate 20 of the measures. As the foundation for this groundbreaking work is already built, and as the state makes changes across its justice system, Florida should actively pursue fully populating the data portal toward continued and sustained performance measurement across counties, across the state and, as the Measures advance, across the country. Florida would lead the nation in having access to these important data, already significantly underway; data can be the launching point for change. See Measures for Justice and Counting Criminal Justice to Save Money and Improve Public Safety.
A Single Offense, No Probation to Consider: In the simplest of cases, someone is convicted of a single offense and sentenced directly to prison, with no prior term of probation. In this case, the offense for which he or she was convicted — be it drugs, burglary, or assault — appears as both the Committing Offense and the Longest Sentenced Offense. Since FY1998, 29 percent of people admitted to prison had cases like this.
Multiple Offenses: When someone is sent to prison for multiple offenses, a ranking system is required to identify the single most important offense. The definitions in this report use different ranking systems, occasionally producing different results. For instance, if a prisoner was sentenced to three years for assault and also sentenced to twelve years for a drug offense, his Committing Offense would be the assault charge while the Longest Sentenced Offense would be the drug offense.
Probation and Parole Violations: Thirty percent of people sentenced to prison in Florida since FY1998 were sentenced to prison for a violation of probation. If an individual was sentenced to probation for burglary and subsequently sentenced to prison for a violation of the terms of probation, his or her Committing Offense would be a violation of Probation. The Longest Sentenced Offense would be burglary.
Multiple Offenses and Probation Violations: Some people committed new offenses while on probation, and were sentenced both for a violation of probation and for a new offense. Take someone on probation for assault who violated probation and was sentenced to prison for a new burglary charge. If both cases were sentenced to the same amount of time, the Committing Offense would be burglary (it was the offense that most proximally precipitated his or her incarceration), and the Longest Sentenced Offense would be assault. Longest Sentenced Offense ignores violations of probation and, if sentence lengths are equal, prioritizes more violent offenses.
First Circuit — Escambia, Okaloosa, Santa Rosa, and Walton
Second Circuit — Franklin, Gadsden, Jefferson, Leon, Liberty, and Wakulla
Third Circuit — Columbia, Dixie, Hamilton, Lafayette, Madison, Suwannee, and Taylor
Fourth Circuit — Clay, Duval and Nassau
Fifth Circuit — Citrus, Hernando, Lake, Marion, and Sumter
Sixth Circuit — Pasco and Pinellas
Seventh Circuit — Flagler, Putnam, St. Johns, and Volusia
Eighth Circuit — Alachua, Baker, Bradford, Gilchrist, Levy, and Union
Ninth Circuit — Orange and Osceola
Tenth Circuit — Hardee, Highlands, and Polk
Eleventh Circuit — Dade
Twelfth Circuit –– DeSoto, Manatee, and Sarasota
Thirteenth Circuit — Hillsborough
Fourteenth Circuit — Bay, Calhoun, Gulf, Holmes, Jackson, and Washington
Fifteenth Circuit — Palm Beach
Sixteenth Circuit — Monroe
Seventeenth Circuit — Broward
Eighteenth Circuit — Brevard and Seminole
Nineteenth Circuit — Indian River, Martin, Okeechobee, and St. Lucie
Twentieth Circuit — Charlotte, Collier, Glades, Hendry, and Lee
Deborrah Brodsky is the Director of the Project on Accountable Justice. Cyrus O’Brien is a Consulting Researcher to the Project on Accountable Justice and a PhD Candidate at the University of Michigan. Alexandra Raynolds and Nicholas Truitt are Interns at the Project on Accountable Justice and MA students at the Florida State University College of Social Social Sciences and Public Policy.
This report was funded through a generous grant of the Charles Koch Foundation and the general operational support of PAJ’s sponsors. For more information about the PAJ, its institutional partners and supporters, and the distinguished volunteers who serve to guide activities of PAJ, please visit the PAJ website at iog.fsu.edu/paj/. Any findings, opinions, or recommendations expressed herein are those of the Project on Accountable Justice.
The James Madison Institute and Charles Koch Institute, “New Poll: Strong Majority of Floridians Agree The Time For Criminal Justice Reform is Now,” https://www.charleskochinstitute.org/majority-floridians-agree-criminal-justice-reform-now/ (September 2016).
Data-Driven Documents (or D3) use a javascript library developed by Mike Bostock, formerly of the New York Times. The Project on Accountable Justice is indebted to him as well as others who shared their open-source code for visualizations, especially Chris Given, Juan Cruz-Benito, and Justin Palmer. This website is built in Jekyll using Markdown and hosted on Github pages, and owes thanks to Amanda Visconti at The Programming Historian. The background image at the top of this page is a satellite photo of the area near Union Correctional Institution and Florida State Prison in Union and Bradford Counties. See Amanda Visconti, “Building a static website with Jekyll and GitHub Pages,” Programming Historian, (2016-04-18) and Google Maps, Union Correctional Institution and Florida State Prison, Bradford and Union Counties, Florida., (n.d.), retrieved April 15, 2017.
A small island nation in the Indian Ocean, Seychelles, has the highest incarceration rate in the world, according to the World Prison Brief. The Seychelles incarcerates fewer than 800 people. Data for OECD countries comes from the Organisation for Economic Co-operation and Development (OECD), Society at a Glance 2016 (Paris: OECD Publishing, 2016), p. 133. Data concerning Florida date from 2015. Danielle Kaeble and Lauren Glaze, Correctional Populations in the United States, 2016 (Bureau of Justice Statistics, December 2016)Cuba data are from Peter Wagner and Allison Walsh, States of Incarceration: The Global Context (Prison Policy Initiative, 2016). Estimates of North Korea’s prison population are from David Hawk, The Hidden Gulag: The Lives and Voices of “Those who are Sent to the Mountains” (Second Edition) (Washington, DC: Committee for Human Rights in North Korea), 2012 and were combined with population from The World Bank, Population Totals, 2017. See also Roy Walmsley, World Prison Population List, 11th Edition, World Prison Brief and Institute for Criminal Policy Research, 2016.
The data underlying this visualization show only state imprisonment, not other types of incarceration (which could include detention in local jails, federal imprisonment, immigration detention, and juvenile incarceration). Data from 1978 to 2015 are drawn from the Bureau of Justice Statistics, National Prisoner Statistics: Corrections Statistical Analayis Tool — Prisoners . Data from 1970 to 1977 are calculated from Bureau of Justice Statistics, Historical Statistics on Prisoners in State and Federal Institutions, Yearend 1925-86, (1982) and US Census Bureau, Population in the United States, 1900-2014 (accessed via API through Google’s Public Data reference center). These data come with many caveats, and different states, at different times, counted their prison populations slightly differently. For a full explanation of the data, see notes on the raw data (clicking here will download an excel file). To read how 10-20-Life has impacted people for firing warning shots, see Steve Bousquet, “The Warning Shot that Condemned Orville Lee Wollard to Prison and Changed Florida,” Tampa Bay Times (February 4, 2016).
For a comparison on New York and Florida, see Pew Center on the States, State of Recidivism: The Revolving Door of America’s Prisons (Washington, DC: The Pew Charitable Trusts, April 2011). See also Federal Bureau of Investigation, Uniform Crime Reports: Crime in the United States, 2000-2015.
The cost of incarceration in Florida is based on the FY2015 per diem of confining one prisoner ($54.99), a figure that includes administrative costs and is used throughout this report. See Florida Department of Corrections, FY2014-2015 Annual Report.
For a sense of how quickly Florida changed its laws relating to drugs, see the legislative history of Florida Statutes Chapter 893. These construction figures count annexes to existing institutions as new facilities. See Florida Department of Corrections, FY2010-11 Annual Report.
Correctional Reform Act of 1983, 1983 Laws of Florida, Chapter 83-131. The ceiling was repealed in 1989. See 1989 Laws of Florida, ch. 89-531.
For a fuller account of efforts in the 1980s to reduce Florida’s reliance on confinement, see Mark Dykstra, “Apart from the Crowd: Florida’s New Prison Release System,” Florida State University Law Review 14:3 (Fall 1986).
For an account of Florida’s War on Drugs and the increasingly punitive nature of its criminal justice system, see Heather Schoenfeld, “The War on Drugs, the Politics of Crime, and Mass Incarceration in the United States,” The Journal of Gender, Race and Justice 15:2 (April 2012), 315-352.
The Collins Center for Public Policy and Florida TaxWatch, A Billion Dollars and Growing: Why Prison Bonding Is Tougher on Florida’s Taxpayers Than on Crime (April 2011).
State of Florida Division of Bond Finance, “Official Statement” [Regarding Master Lease Agreement with Florida Correctional Finance Corporation, Series 2015A], 2015. For debt service to be paid until 2029, see page 20.
In this chart, Parole Violations refer to multiple types of conditional release administered by the Florida Commission on Offender Review. Parole was largely abolished in 1983, meaning only people sentenced prior to 1983 (with the exception of people convicted of capital offenses prior to 1994) are under the parole system. The Commission on Offender Review nonetheless administrates several other forms of conditional release, including Conditional Release, Control Release, Conditional Medical Release, and the Addiction Recovery Supervision Program. In FY2016, the Florida Commission on Offender Review revoked 1,835 conditional releases (of one form or another), making it a significant contributor to Florida’s prison population. For a full account of the role of the Florida Commission on Offender Review, see Florida Commission on Offender Review, 2016 Annual Report.
Florida TaxWatch Center for Smart Justice, Review of Criminal Justice Data (December 2011), 15.
County and Circuit population data for all charts in this report include all adults age 18 and older, and are derived from 2015 population estimates. See C. Puzzanchera, A. Sladky, and W. Kang, “Easy Access to Juvenile Populations: 1990-2015.” (Office of Juvenile Justice and Delinquency Prevention, Department of Justice), 2016.
The adult incarceration rate of the United Kingdom refers to only that of England and Wales (which is higher that those of Northern Ireland and Scotland) and was calculated from Peter Wagner and Allison Walsh, States of Incarceration: The Global Context (Prison Policy Initiative, 2016) and Office of National Statistics, Population Estimates for UK, England and Wales, Scotland and Northern Ireland: Mid-2015 (June 2016).
E. Ann Carson, “Prisoners in 2015,” Bureau of Justice Statistics (2016).
See footnote 14.
Since Florida effectively abolished parole in 1983, more than a dozen states followed. Most states, however, maintain mechanisms for discretionary release. For more details about the national context of parole and discretionary release, see Joan Petersilia, Edward Rhine, and Kevin Reitz, “The Future of Parole Release,” in Justice Futures: Reinventing American Criminal Justice, Vol. 42 of Crime and Justice: A Review of Research, Michael Tonry, ed. (Chicago: University of Chicago Press), 2017. For statistics regarding elderly inmates, see Crime and Justice Institute, An Examination of Florida’s Prison Population Trends (May 2017).
For a review of this research, see John Pfaff, Locked In: The True Causes of Mass Incarceration and How to Achieve Real Reform (New York: Basic Books), 2017.
For the methodology notes of the Florida Department of Corrections recidivism analyses, see Florida Department of Corrections, “Florida Department of Corrections Recidivism Report: Florida Prison Recidivism Study, Releases From 2008 to 2014, December 2016.
See footnote 14.